2026 update
UK House Prices & Indices
Everything you need to know!
Keep reading to discover…
- The truth about UK house prices
- The pros & cons of all the major house price indices
- How and where to get accurate information
- And lots more…


"TheAdvisory drips in honest-to-goodness practical advice for todays house sellers"
Table of Contents
-
House prices + the media = Big problems
-
What is the current UK average house price?
-
Comparison Table: UK House price indices
-
Problems with property price indices
-
How the indices can help you
-
How to think intelligently about house prices & market forecasts
-
Should you let all this affect your moving plans?
-
Final thoughts
-
Related guides
House prices + the media = Big problems
Although the media regularly report and comment on the property market, it is often done with a poor understanding of how the different property indices measure property prices.
The key measure is the ‘average’ price for regions and maybe towns and cities but, as property prices are so individual, these are unlikely to reflect what is actually happening to prices for the property you would like to buy or sell.
In addition, property indices tend to report price changes month on month or year on year so, as happened with the credit crunch in 2007, prices fell on average by around 17% to 2009, when prices started to recover the 17% fall, this was reported as price increases.
Example:
- 2007 – property purchased for £200,000
- 2007 – price fell to £171,000
- 2009-10 – price rose by 10% to £188,100
Media reports a 10% price increase, despite property still being worth 6% less than purchase price.
In addition, although the ‘average’ may have risen by 10%, this may be made up of prices falling in some areas and rising by a lot more than 10% in other areas.
The ‘average’ property price and the percentage increase/decrease year on year is therefore not a good guide to what is happening to your own individual property markets.
What is the current UK average house price?
Sadly there’s no one definitive answer to that…
Here is a snapshot (Feb 2018) of the ‘average’ property price from six indices which are often quoted in the media:
Comparison: Reported UK average house prices
| Indices | Snapshot - Feb 2018 | Annual change | What the index measures | Areas covered |
|---|---|---|---|---|
| Rightmove | £300,001 | +1.5% | Asking prices | E & W |
| Nationwide | £210,402 | +2.2% | Mortgages only | UK |
| Halifax | £224,353 | +1.8% | Mortgages only, seasonally adjusted | UK |
| Hometrack (ZPG) | £211,100 | +4% | Sold prices | UK |
| LSL Acadata HPI | £299,556 | +0.6% | Actual prices, includes cash sale | E & W |
| UK HPI (Gov) | £225,621 | +4.9% | Sold prices, includes cash sales and new builds | E |
- As you can see, the highest ‘average’ price is marketing prices from Rightmove at £300,001 and the lowest ‘average’ price is Nationwide’s mortgage average of £210,402…
- That’s an astonishing difference of nearly £90,000.
- When it comes to looking at the property price changes these indices are quoting to the media this year versus last, it varies from 0.6% through to 4.9%.
Confusing isn’t it?
So which of the 6 indices are right and which can you trust?
The reality is, they’re all correct, according to three measures:
- Whether they measure properties across the UK, England and Wales or just England.
- The stage in which they record the price of the property and what type of transactions they include, for example mortgage only or including cash sales and new builds.
- How they calculate the average and which average measure they use.
I said it was confusing!
The best way to think about how much prices can vary is to consider what happens to a property’s price from 1st day of marketing up to completion of a successful sale.
For example, one property could, in theory, have four different prices recorded by the indices:
- price #1: Asking price £199,999 (Rightmove)
- price #2: Offer price accepted £190,000 (Hometrack)
- price #3: Mortgage valuation £185,000 (Halifax/Nationwide)
- price #4: Final agreed price £187,500 (UKHPI/LSL Acadata)
So the difference from the ‘asking price’ through to the ‘final agreed sale price’ recorded on the Land Registry is 6.2% (£199,000 – £187,500).
Comparison Table: UK House price indices
Comparison Table: UK House price indices
| House price index: | Compiled by: | Data source: | Coverage: | Price recorded: | Mix adjusted: | Seasonally adjusted: | Pros: | Cons: | Vested interest: | Reliability: |
|---|---|---|---|---|---|---|---|---|---|---|
| Rightmove Index | Property portal | Properties for sale advertised by estate agents | England & Wales | Asking prices | Yes | No | Gives a 'lead indicator' of the current market , so 'movement trend' is useful | Reports on prices of properties which aren't sold so 'average house prices' are ridiculously high versus actual | Secures regular PR | Only of use as a guide to whether prices may fall/rise in future, don't use the actual prices they quote |
| Nationwide Index | Lender | Own lending data | UK | Price agreed post mortgage valuation | Yes | Yes | Accurate from a mortgage lending perspective and movement | Does not track cash sales, so low 'average' | Secures regular PR | One of the biggest lenders, so good track record |
| Halifax Index | Lender | Own lending data | UK | Price agreed at time of loan | No | Yes | Good historic research analysis | Tends to suggest a 'higher' trend in price growth than other indices | Secures regular PR | Can vary depending on volumes |
| RICS Index | Surveyors | Surveyors | England & Wales | Surveyor valuations post offer stage | No | Yes | A good lead indicator of supply/demand and what will happen to prices | Doesn't give actual prices, more a survey on independent valuers views of the market | Promotes RICS | Very good, has proven to be a good indicator of future rises/falls in property market |
| Hometrack | Automated valuations | Sold price data & mortgage lending | 65 cities in the UK | Mix of mortgage valuations and price paid | No | No | A good indicator of what's actually happening at a city level | Non comparable to other indices | Promotes Hometrack (now part of ZPG) | Very reliable from a city perspective |
| LSL Acadata | Data consultancy | Sold price data from conveyancers | England & Wales (separate index for Scotland) | Final sale price | Yes | Yes | Includes most sales and accurate for movement each month | Figures change post publishing | LSL has agency, but reports by Cambridge Economists | Reliable for what 'has' happened, not what is happening now |
| UK HPI | GOV.UK | Sold price data from conveyancers | UK | Final sale price | Yes | Yes | Includes most sales eg. cash/new build | Lags current market by some months | No bias | Reliable for what 'has' happened, not what is happening now |
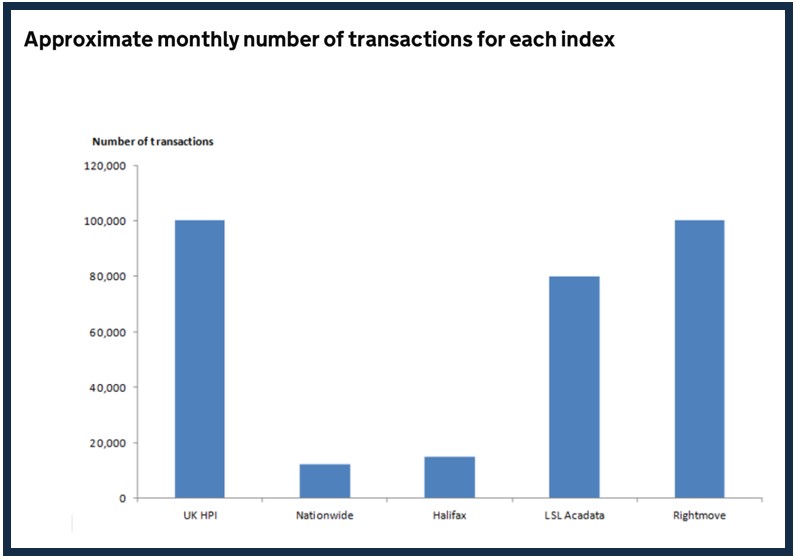
Number of transactions analysed
Problems with property price indices
- The main problem with property price indices is they don’t help buyers or sellers to know whether the price of their property is more or less than it was bought for.
- They also cover too wide an area, such as England or the North East or Greater London.
- Today we find that property prices can vary for different property prices, even within a mile of each other.
- For example, in one street, two-bed properties might always be in demand, so rarely lose value and tend to sell quickly for an ever-increasing price as more buyers are always chasing few properties.
- Half a mile down the road, there may be lots of two-bedroom flats which were built a few years ago and opposite them some brand new ones, so lots of sellers chasing a few buyers.
- Quite simply this will push prices down as sellers compete on price to secure a buyer.
- Unfortunately, the property price indices are often reported verbatim in the press which tend to be more trusted than a local agent, despite the fact that a good local agent is really the best source to find out what is happening to prices for a property you want to sell and/or buy.
Check that estate agents are telling you the truth about your local market….
Check: PropCast™ – The UK housing market weather forecast
Why do house price indices differ?
There are 5 key reasons:
#1. Timing
Buying and selling property can take three to twelve months and, during this time, prices can vary.
Marketing prices tend to be the highest, while prices recorded at final sale tend to be lowest.
#2. Coverage
Some take data for the whole of the UK, others break it down, with some doing England and Wales only, while others separate out England, Scotland, Wales and N.Ireland.
#3. Property sales the data includes
Since the credit crunch, anything from 30-40% of property sales are cash only, not involving a mortgage at all.
Some indices include all sales, while others just include mortgage sales.
#4. The ‘average’
You would think there was only one way to calculate an average, but there isn’t!
There are three ‘averages’ which can be quoted:
- Arithmetic mean
- Geometric mean
- Median
Here is how they are calculated:
Arithmetic mean – Let’s take a set of numbers eg. 5 & 10. To calculate the mean, you add up both numbers (5+10=15) and divide by 2 = 7.5.
Geometric mean – This is a little more complicated, but in our example of 5 & 10, you would take 5 x 10 and, as there are two numbers, you would take the square route of ½ power. The average in this case would be 7.
Median – If we take our two numbers of 5 & 10, the median would be similar in this case to the arithmetic mean ie 5 + 10 /2 = 7.5. However, if there were three numbers such as 5, 8, 10, the ‘median’ would actually be 8.
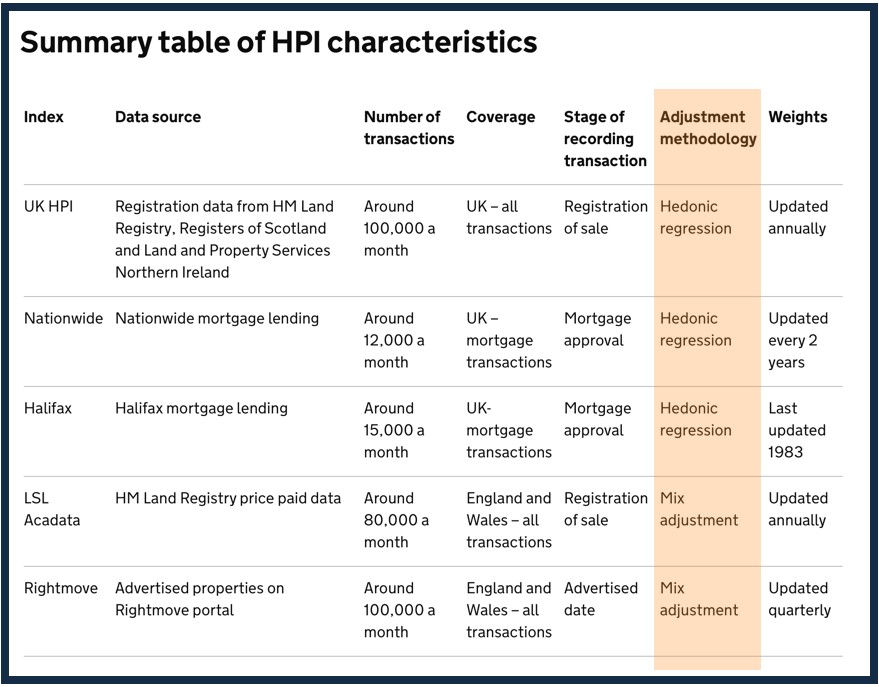
#5. Different adjustment methodology
The four you need to know are:
Mixed Adjustment – This isolates potentially misleading price changes, for example if more flats are sold one month to the next, or one region sells a lot more properties than another, these ‘anomalies’ are essentially ironed out.
Hedonic Regression – This does a similar job in that it checks the rise in average prices is a true one, not just influenced by more of one property type eg terraces selling more than eg detached homes.
Repeat Sales Regression (RSR) – Under the RSR method, house price growth is measured by looking at houses which have been bought or sold more than once.
The image below summarises key UK indices and shows the different adjustment methodology being used…
‘Seasonally Adjusted’ is another term you’re likely to hear. This smooths out the figures to take into account of seasonal highs and lows. This has been criticised by some because it can lead indices to report ‘growth’ in the market when in actual fact, the market has ‘fallen’ on an ‘actual’ basis. But we’ll let the statisticians argue this one!
Why are house price indices misleading?
Simply, property price indices are misleading because they use an ‘average’ which is based on a lot of different properties and the movement of these averages doesn’t necessarily reflect what’s happening to the specific price of a property you are buying or selling.
What happens to prices relies mostly on the number of sellers chasing buyers and vice versa. Typically if there are more buyers than sellers for your property, prices will rise and if there are more sellers than buyers, prices fall. This is why local agents – the only people who understand this dynamic – are essential to advise you on property price trends.
However, to be fair to the indices, it’s not necessarily their data which is misleading, it is more the unnecessarily dramatic use of the headlines by PRs and the media.
Newspapers make their money based on the number of people who click on their articles online or buy the paper. Unfortunately headlines which tell the reality such as ‘prices expected to grow at their long term annual rate over the next five years’ do not gain as much interest as ‘house prices to rocket by 25% over the next five years’!
Some channels and property papers do report prices correctly, though. For example, the BBC teams, in the main, are very aware that property prices and changes differ dramatically across the country. And because they are based in London, Manchester and have local news channels, they tend to produce more ‘regional’ data than give a headline figure.
However, even regional measures of the property can be misleading unless they are explained properly. The main conflict which occurs with house price indices is when they are rising rapidly or falling rapidly.
When they are stable over a period of time, despite the fact they measure property prices at different times of a purchase and sale, the indices tend to agree ‘prices are slowly rising’ or ‘slowly falling’.
But when prices are rising rapidly or falling hard, the Rightmove Index will measure sales prices which reflect what sellers feel at the time, so very current while the Land Registry could be reporting on property sales which happened 3-6 months ago, so they could still be measuring the market as rising.
So the more volatile the market, the more the property price indices will give a conflicting picture and it is not unusual for the media to say prices are rising one day and falling the next!
How the indices can help you
The indices are valuable tools when you know what each of them is good for…
For example:
Rightmove Index
- This is useful data to tell us what sellers and agents ‘think’ is happening to the market.
- If they report marketing prices are falling then it might not be the best time to sell your property, or if you have to sell, pricing keenly could ensure you get a sale when others are misreading the market and trying to ‘over price’ to get the best deal.
Hometrack City Index
- This is a good report as it does tell you what’s happening year on year in 65 towns, so is quite specific and, as long as you work out if your property or the one you are buying rises and falls in line with local averages, then this might be useful to track.
- If your property is unique though, then only a local agent can help guide you.
- Or you can check out more micro location analysis and find out if your market is ‘hot’ or ‘cold’ by checking PropCast™.
Nationwide & Halifax Indices
- These are useful to know what’s happening ‘now’ in the market from a rise/fall perspective as they tend to be weeks, rather than months behind what’s actually happening.
- In addition they are based on independent valuations, not marketing prices which are typically the price sellers want and won’t necessarily achieve.
Land Registry/LSL Acadata
- This data tells you ‘what has’ happened not ‘what is’ happening now.
- It’s historically accurate, but won’t necessarily tell you what is happening to property prices for a property you are buying or selling.
How positive & negative reports effect the market
What the indices can help you with is to understand if now is a good time to sell (or not).
Most buyers will hold off making offers if the media reports that the indices suggest property prices might fall, or are already falling, and especially if they report a potential crash.
When reports are negative, this happens:
- Buyers hold off
- Sellers panic
- Prices are reduced
- Indices pick up price reductions
- More buyers hold off
- Prices reduce
When reports are positive, this happens:
- Buyers panic and make offers quickly
- Sellers get greedy and put prices up to ‘test the market’
- Indices pick up price rises
- More buyers panic and compete prices upwards
These two scenarios carry on until sellers in a falling market stop putting their properties on the market, so demand falls and the number of properties available for sale falls and vice versa – more sellers put their property on the market hoping for a ‘great price’ and this overtakes the number of buyers.
How to think intelligently about house prices & market forecasts
Property prices, as we’ve seen, are not only incredibly difficult to assess, they are also very difficult to predict.
There are three main reasons for this:
#1. Property prices vary by property and postcode
Most experts try to predict property prices by UK, country and region.
However, as we have already seen, this is rarely applicable to what’s happening to individual properties in the area you own or are buying and selling in.
#2. Property prices are influenced by many factors
One of the reasons property prices are so individual and rarely fit an ‘average’ measurement is because there are so many factors that influence what a property is worth.
For example:
- Land prices and availability
- Supply and demand
- Infrastructure
- Developer capacity
- Mortgage availability
- Economic performance
- Wages and employment
On top of these there is one very big influence which makes property price changes the most difficult to predict and that is…
Consumer confidence!
If confidence in buying or selling a property falls, then it’s likely that prices will fall as a result.
This is so difficult to predict as we found during the credit crunch when stories went from ‘prices rising’ to ‘prices falling’ in a matter of months.
And the opposite can happen. As soon as the government announced the Help to Buy Scheme in March 2013 (which provided up to a 20% loan free of any interest for 5 years), people started to consider moving, even if they weren’t eligible for the scheme.
This announcement helped to ‘turn’ the property market in many places across the country and reinvigorated the market in many areas so prices started to increase post the crash.
#3. Shortage of data
This is a problem for those who are considering predicting prices as the most comprehensive data we have – which is the price achieved for every property on every street which has been bought and sold – only goes back nearly 20 years.
In comparison, for other things regularly predicted such as inflation, interest rates or economic performance, we have data going back for decades and, of course, ‘averages’ for these measures work a lot better.
In other words, forecasting property prices is hard as we are still learning what drives prices up and down.
Should you let all this affect your moving plans?
It is worth knowing what the property indices are saying and what the experts are predicting.
The reason being is this will influence what the media reports and it is these reports that will often influence the supply and demand of buyers and sellers, especially in the short term (a few months).
If the predictions are that prices are going to fall and you are thinking of selling, it might be better to sell sooner rather than later.
However if you are buyer, you have a dilemma. Do you make an offer on the property of your dreams, taking the risk that it may fall? Or do you buy the property now so someone else doesn’t , to avoid missing out on the property for many years to come?
In reality it’s worth taking the predictions into account but, if you are planning to live in the property for the next 10-20 years, it shouldn’t influence you too much as typically property prices will rise and fall during this period.
For most, getting the right roof over your head at a price you can afford is often more important than trying to time when you enter or exit the market.
Final thoughts
House price indices give a useful guide to what has happened on a National & Regional level, but it is unlikely they will explain what’s happening (or happened) to the value of your property (or the one you’re looking to buy).
Although the media create a lot of articles and commentary from these indices, few media outlets give an accurate or well understood guide to what’s really happening to prices.
Many in fact will exaggerate the figures and use them to sell newspapers as opposed to educate and inform you on the property market.
As such, the two best ways to understand what is happening in your area are to:
- Find out if your property market is ‘hot’ or ‘cold’ by checking PropCast™
- Speak to an expert local agents who will give you an honest assessment of what’s happening in your market.
Related guides

Sources, citations & credits
Related guides
Did you
know?..
The hotter your market
the easier your sale...